Visual Analytics

From murky, overwhelming data, achieve clarity through visual analytics.

How We Help

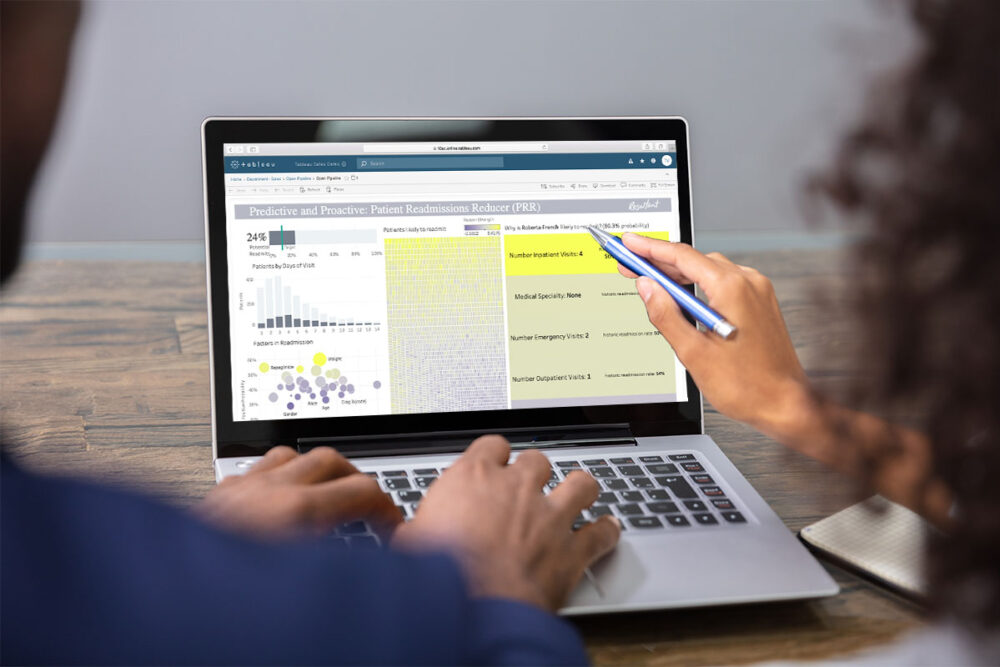
Data gets its own story through visualizations that clarify information and inspire insight.

Is your data exhausting teams, customers, and other stakeholders, or is it supporting their needs? Rapidly multiplying data often brings information overload when it could bring so much more to the table: the exploration, inspiration, and meaning that shows organizations new routes to the outcomes they want.

We help clients walk through their goals and needs to pinpoint what they really want from data, then build visualizations that answer their tough questions. Our team can validate your strategy with rapid prototyping to ensure your approach lives up to your needs. And when we know it’s right, we support your team through the transformation.

Visual analytics makes the difference between overload and insight. When smart, thoughtful visualizations truly support your organization’s strategy, chaos transforms into clarity.

Impact Story

Growing Biopharmaceutical Company Leverages Resultant and Tableau to Create an Informed Commercial Organization

The sales field and leadership were blown away with the visualizations that Resultant created, and the dashboards made a big impact on our metrics for tracking sales results for increased insight generation. Due to the great success we had, our marketing and market access teams immediately requested Resultant efforts on their end.

Matthew Panos

Senior Manager of Sales Analytics,   Dermira, Inc.

We’re proud to help organizations thrive, and we’d love to tell you more.

The Power of Visual Analytics

Turn abstract details into concrete, actionable information that helps you reach the outcomes you want.

  • BI and Visual Analytics

    Are your data visualizations showing what you truly need to know—in the most informative way? Expert-guided BI and visual analytics give straightforward direction from where you are to where you want to be, illuminating pitfalls to define a clear way forward through dashboards, user portals, charts, and graphs.

  • Data-Driven Decisions

    Make the move from hunches to informed decisions. Visual analytics makes clear where information gaps lie and uncovers your greatest opportunities for progress through expert data solutions. Lose the guesswork and find your most effective operations and strategy.

  • ROI from Impactful Data

    When you’re ready to invest more in your data, start by improving visual analytics. You’ll achieve greater clarity and find untapped opportunities through interactive dashboards that show your teams the information they really need with lasting solutions that quickly deliver ROI.

Related Capabilities

We help clients strategize and build data visualizations so they can tackle their most complicated problems.

Supporting Software Platforms

We believe in empowering self-service analytics and leveraging automation through software technology, enabling clients to get to better data, better insights, and better results—faster. To achieve this, we recommend whichever best-in-class industry software platforms fit your specific needs and solutions. Here are just some of our trusted partners.

Connect

Bring order—and insight—from the chaos of data through smart, strategic visual analytics.

Where chaos reigns, visual analytics offers clarity.

You have all this data, and it’s growing exponentially. But finding answers within it can feel like trying to unearth that one last AAA battery from deep within your kitchen junk drawer. You’re much more likely to come up with handfuls of paperclips and—good grief—popcorn kernels than the item you need.

Visual analytics shines a light on the hidden treasures your data holds. Think of it as a data analytics and visualization dream team, putting in place the analytical processes to drive decision making and giving those processes a compelling life through smart visualizations. The information you need to answer complex questions and achieve the outcomes you want is right where you need it, and you don’t have to dig through a morass of “almost” and “not quite” to find it.

Any visual analytics project we undertake starts with strategy. We work with you to understand exactly where you stand and what obstacles stand in your way. In most cases, we can use our rapid prototyping process to achieve a quick proof of concept and help you sprint to ROI. When you’re ready to launch, we make sure your teams are right there with you, offering the training and preparation that ensures they embrace the transformation. Stop digging through data junk drawers. Achieve real insight with smart, tailored visual analytics.

Insights delivered to your inbox