Gamechanger is a term that is sometimes thrown around casually, but in the case of Tableau 2020.2 it is not simply a buzzword. Tableau has released one of the most paradigm-shifting features in years along with a plethora of new functionality that make life and visual analytics a lot easier. Here’s some of what the new release has in store:
Data Modeling & Relationships
Data modeling truly is a gamechanger. In the past, if you had multiple data sources at different grains (levels of detail), then you likely have faced the complexities and limitations of using Level of Detail expressions or data blending to get the right answers. And if you wanted to share these sources with across your organization, you’d have to worry about whether the complexities would be understood or possibly lead to unintentional error. Tableau 2020.2 and the new Data Modeling solves these issues.
Consider some of the various scenarios where you might want to establish a relationship between data sources of different levels of detail:
Each of these examples presents a challenge for relating data at different levels of detail. For example, individual expenses are often tracked against monthly budgets. But if you’ve ever tried to relate these type of data sets, you’ve faced some tough decisions. Do you try to join them together and use Level of Detail expressions to account for duplicated budget values? Do you use data blending and face complexities and limitations with filters? And with both options, what about budget lines that don’t have any expenses (yet) or expenses that aren’t budgeted? They could go unreported.
But with Tableau 2020.2 Data Modeling, you’d simply bring both data sources into Tableau’s Data Source window:
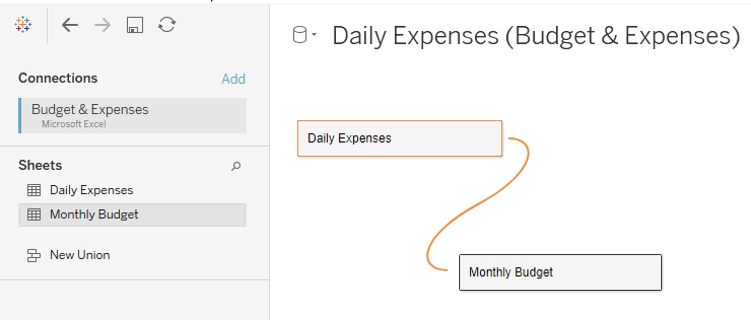
The flexible “noodle” connector indicates the new Relationship of the Data Model and you can specify which fields define the relationship. Each object may be a single table or view or may be an entire structure of tables, defined by classic joins. For example, Daily Expenses may consist of an expenses table joined to a Department table and to a Region table. That classic join model is available with a double click on the Daily Expenses object.
Once you’ve defined the relationship, you’ll find that analytics is a breeze: it’s the instant drag-drop at the speed of thought that you’re used to with Tableau. In fact, you’ll find the Data pane sports a new design with dimensions and measures grouped together by table:
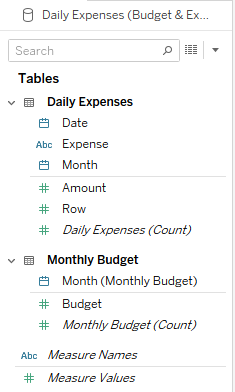
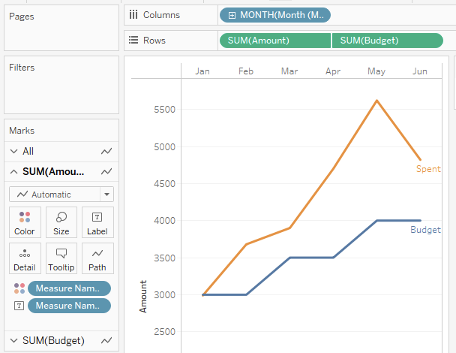
While this may take a bit of getting used to at first, you’ll immediately appreciate getting the correct answers you want. No more worrying that each transaction duplicates the budget value. No more creating Level of Detail expressions to handle mis-matched data sources manually. Here are the instant drag-and-drop results:
Set Improvements
Up to this point, you’ve probably used sets sparingly in Tableau, but get ready to start employing them to solve all kinds of analytical challenges and to improve user interface on your dashboards. For one thing, Tableau has added a set control. Now end users can dynamically change which values are included in a set:
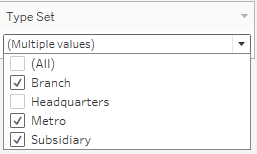
At first glance, this looks like a multi-select filter. And you might wonder, “what’s the difference?” Well, a filter is a filter – when values are excluded you won’t see them represented in a view. But with a set, you have all kinds of options. Do you want to highlight the portion of a bar for values that are included in the set? Do you want to use the set in a calculation? Do you want to highlight values that are not included in the set? All of these are possible with sets.
Also improved in Tableau 2020.2 are set actions. You can now specify that an action should add values to the set or remove them from a set. This kind of fine-tuned control will give you the ability to solve all kinds of analytical problems that were more of a challenge before.
Other New Features
There are too many new features to go into detail on each, but here are some others that are worthy of a mention:
How to Get Started?
If you are looking to get started with the latest version of Tableau and to leverage the analytical power, we’d love to help you!