Especially meaningful challenges deserve to be met with creative, effective solutions that help students thrive. Learn more about our education services.

Transcript
Show ID [00:00:04]:
The power of data is undeniable, and unharnessed, it's nothing but chaos.
The amount of data was crazy.
Can I trust it?
You will waste money.
Held together with duct tape. Doomed to failure.
Show ID [00:00:16]:
This season, we're solving problems in real-time to reveal the art of the possible. Making data your ally, using it to lead with confidence and clarity, helping communities and people thrive. This is Data-Driven Leadership, a show by Resultant.
Jess Carter [00:00:33]:
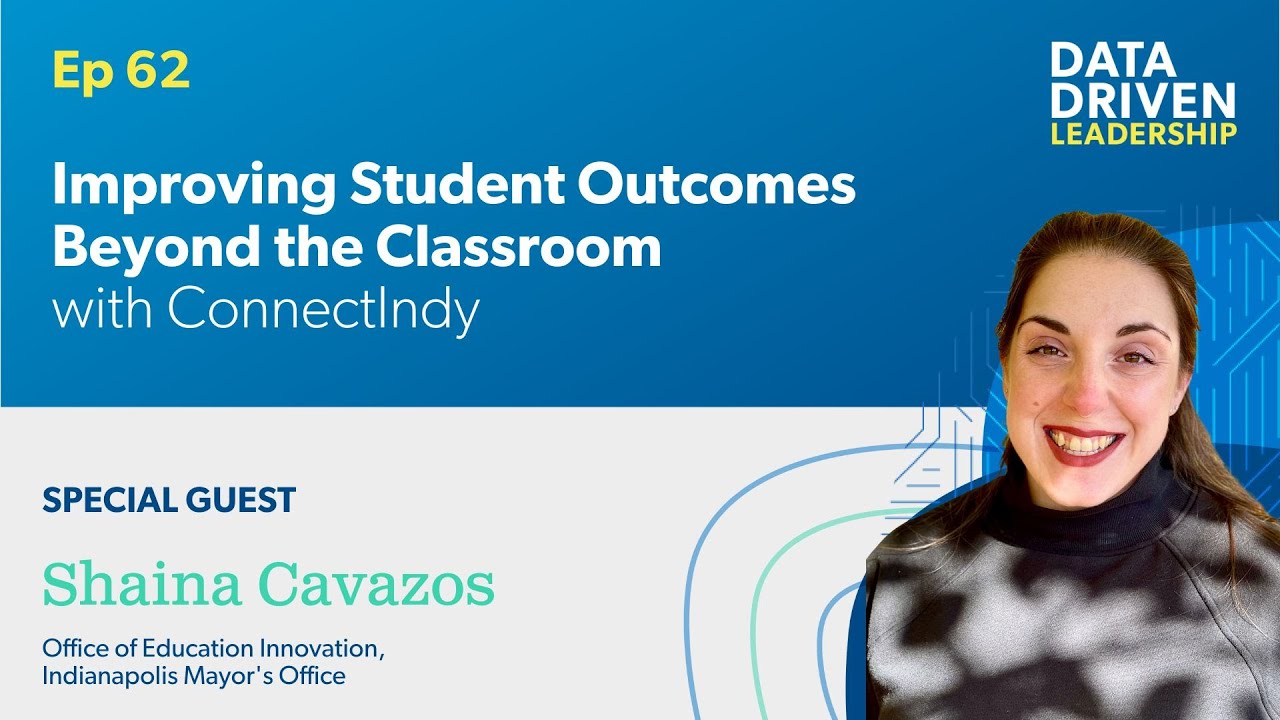
Hey, everyone. Welcome back to Data-Driven Leadership. Today we're thrilled to have Shaina Cavasoz with us. Shaina is the director of the Office of Education Innovation at the Indianapolis Mayor's Office, and she's here to talk about this super cool initiative called ConnectIndy. ConnectIndy stems from the City Connects program originally developed by Boston College.
Jess Carter [00:00:55]:
This program addresses out of the classroom factors that affect learning potential, capturing data that helps schools better understand their students. City Connects is already making an impact in 200 public, private, and charter schools across Massachusetts, Ohio, Minnesota, and Indiana. Interesting fact, I actually remember watching an interview years ago about Boston College as they were rolling this program out and it's super cool to now see it impacting Indiana.
What makes this program truly unique is its holistic approach to understanding a student's full experience. It goes far beyond traditional academic metrics by delving into students’ strengths, their needs, and their interests. Through this process, City Connects coordinators work really closely with teachers and school staff to identify each student's unique profile, which I think is super neat. Based on this assessment, the coordinators develop a tailored plan of services and enrichment activities, offering families and caregivers personalized recommendations to support the student's growth.
Jess Carter [00:01:51]:
Once the plan is in place, the coordinator takes action and follows up throughout the school year, adjusting the plan as needed to ensure it continues to meet the student's evolving needs. This comprehensive approach empowers educators and stakeholders with actionable data, enabling them to make informed, impactful decisions that truly benefit students. What's so important about this program is that it doesn't place the burden of addressing all these external factors on teachers. Instead, it's managed by a dedicated coordinator at the school who takes ownership of connecting the dots. This ensures that teachers can focus on the classroom instruction while the coordinator works to align the right resources, services, and support system to meet each student's unique needs. As we discuss this groundbreaking initiative, I encourage you to check out the dashboard linked in the show notes. It's so cool. It's an incredible resource offering a deeper dive into the data and showcasing just how transformative this approach can be.
Jess Carter [00:02:45]:
Seriously, the insights are fascinating. You're not going to want to miss it. Keep listening as we dive into how data can drive meaningful transformation in education and beyond. And hear directly from Shaina about the powerful impact of ConnectIndy. Let's get into it.
Welcome back to Data-Driven Leadership. I'm your host, Jess Carter. Today we have Shaina Cavazos, director of the office of education innovation at the Indianapolis Mayor's Office.
Jess Carter [00:03:11]:
Let's get into it. Shaina, welcome.
Shaina Cavazos [00:03:13]:
Thank you so much, Jess.
Jess Carter [00:03:14]:
I'm excited to be here. Yeah, I'm excited for us and for our listeners. So I'm going to kind of jump right in because I'm super excited. So my first sort of quiz for you, if I can put you on the spot, is like, if we're in an elevator and you wanted to tell me about City Connect, what would be your elevator pitch about it? How would you explain it in like, brief?
Shaina Cavazos [00:03:34]:
Yeah, so City Connects is a program that tries to address all of kids needs inside the classroom, outside the classroom, but doesn't want to make it the teacher's sole job to do that because so often that's what happens, right? But with City Connects, you have a single coordinator who's responsible for connecting kids to their community and neighborhood services so that they could show up to school ready to learn.
Jess Carter [00:03:59]:
Okay. Okay, cool. And if I asked for like, a literal example, just because I'm not familiar with this, like, what does that look like as opposed to a teacher normally having to care about some of these things and handle them?
Shaina Cavazos [00:04:12]:
Yeah. So, you know, normally I think like teachers are best at teaching and making sure that kids can learn literacy and math and social studies. They're not experts in where do you find eyeglasses? Often though, they're the ones who are right there in front of a student and they're also plugged into their community, to their school community. So a City Connects coordinator kind of takes that burden off of the teacher and what they would do, let's say a kid needs eyeglasses so that they can read the board and play at recess and gym and music and all those other things. The coordinator is doing regular check-ins. They have a whole evaluation process with a student, with their family, and they can say, hey, it looks like Johnny is having trouble reading the board. It seems like, let's get him tested. And then you know what, we have an eye doctor a couple miles down the road who we can connect you with so you can get him what he needs.
Shaina Cavazos [00:05:04]:
And so yeah, when you put like one person in charge of it, it just makes everything more intentional. And it's a clear point of contact for a student and their parents.
Jess Carter [00:05:13]:
Yeah. And not like 17, I imagine, for different needs you might have. It's like there's at least a, like a coordinator, right?
Shaina Cavazos [00:05:20]:
Yeah, no, exactly.
Jess Carter [00:05:22]:
That is so neat. City Connects is not something that Indianapolis is rolling out as the first iteration. It's been around. Is that right?
Shaina Cavazos [00:05:30]:
Yes. It has a rich history. So we are benefiting from, I think, more than 20 years of practice started by Boston College with the Mary Walsh Center for Thriving Children. They are the ones who created City Connects, created the practice, kind of the whole methodology behind it. Because that, I think, is also what's really special. It's not just a collection of great resources and organizations working together. Those things all are happening, but it's informed by this really specific practice that helps that coordinator kind of know exactly what to do to make sure a kid is evaluated and getting the things that they need. So there's a lot of evidence and data.
Shaina Cavazos [00:06:09]:
Right? That's why we're here about why this is successful and how it helps students learn better, too.
Jess Carter [00:06:15]:
That is so cool. So where is the city of Indianapolis on this journey?
Shaina Cavazos [00:06:21]:
City Connects was brought to Indianapolis in, I think, 2021, 2022. Actually, my predecessor, Patrick McAlister, he was the former director at OEI, and he was so excited when he learned that this existed, and he thought, this is exactly what we needed here. And so he kind of made it his mission to do whatever he could to bring it to Indianapolis. And so he worked with a variety of partners, including Marian University, the Center for Vibrant Schools over there, they're the ones who administer it here now, both in Indy and across the state. And he just started kind of making the case that we really need this kind of program here. And so it kind of timed out fortuitously because at the city, we had the American Rescue Plan funding, which was allowing us specifically to try to address the needs of kids in this post-Covid world.
Shaina Cavazos [00:07:10]:
And so, you know, thanks to Mayor Hogsett, thanks to the City-County Council, who approved our ability to invest in City Connects as part of all of that rescue plan funding, we were able to fund a program in Indianapolis for three years. So we're in year three with about a dozen schools kind of on the far east side of the city, but Marian University administers it across Marian County and statewide. So we're kind of part of this larger network. And I'd say we're still pretty new compared to what all the research the folks in Boston have done, but I think, well on our way to seeing some, some really exciting results.
Jess Carter [00:07:46]:
That's amazing.And again, if I'm asking questions where you're like, we're not there yet, that's okay. I'm always interested in, like, program evaluation or program efficacy, especially when it's around like human behavioral intervention. Like, that is just fascinating to me. And so is there data we already have about the program's efficacy in Indianapolis or is it more like that will pay off after the three-year program?
Shaina Cavazos [00:08:09]:
So I think it's both because Boston College, they've been doing the program, they have their systems, it's robust, it's impressive. But what I think we haven't seen as much as is how do we see that data in real time? So I know one really explicit part of our work with City Connects was let's build something that can show people what the site coordinators are seeing every day. How do we kind of glean from all the different qualitative types of information that they're using what data might be available, how we can use this to kind of further our own understanding of what schools and students need. And let's put it in a place where anyone can see it. So we built a dashboard.
Jess Carter [00:08:46]:
And it's public, right? Like, like there's like a URL. We can go to it right now, right?
Shaina Cavazos [00:08:51]:
Yeah. connectindy.org.
Jess Carter [00:08:51]:
We will put that in our show notes because I do want people to actually be able to look and see that dashboard. I don't know, when you look at it, like, what are some of the metrics that stand out to you that you think are really important?
Shaina Cavazos [00:09:03]:
It's kind of hard to pick, which is, you know, I'm sure the answer everybody says always, right? I really love the student interest data because I think a lot of times when we're talking about supporting kids in school, we're thinking a lot about things like tutoring or things that are very academic in nature, or, you know, mental health services, counseling, very, very important things. We know kids need that support. But there's also so much joy and happiness that happens in schools that isn't around, like always solving a specific problem. And I really love that with this dashboard, we can show what kids love. So if you look at the interest data in particular, you'll see video games, basketball, cooking, art. Kids have so many different interests. And what the dashboard has showed us too, with the two years of data we have available, is that for the most part, the services the kids are receiving are enrichments. They're, you know, things that are addressing those interests and like the places that they really want to grow and develop as people, in addition to the needs that they have, maybe that are health care-related or tutoring or things like that. So I love that we can show what kids want in addition to what we think that they need.
Jess Carter [00:10:14]:
Man, I'm like, I'm fascinated. I'm actually on, I'm staring at it right now as we talk. It really is so cool. And I'm probably inferring this, but maybe, maybe I just haven't read it yet and I make sure that we're connecting. I'm saying accurate things. What I like about what this tells me about the program is there is this sort of marketplace between what students need to thrive and us acknowledging what they already say are their interests. So it's like a needs and interest marketplace where if we're going to try to connect the dots about their needs, there's also a tangible place to go to anticipate how we might meet those needs in a way that would align to their strengths. Am I making this up? Is that reasonable?
Shaina Cavazos [00:10:51]:
No, I think those are like exactly the kinds of dots that we're wanting people to connect. Because so much of providing services and even philanthropy is just based on what adults think might be true. You know, well-intentioned adults, adults who care about helping kids. But you know, in this case, we have survey data. You know, psych coordinators do a lot of work understanding what's going on with a particular student and their family. And you know, of course we're protecting everyone's privacy. Nothing is identifiable. But like you could go and see at a school what are top interests at that school.
Shaina Cavazos [00:11:22]:
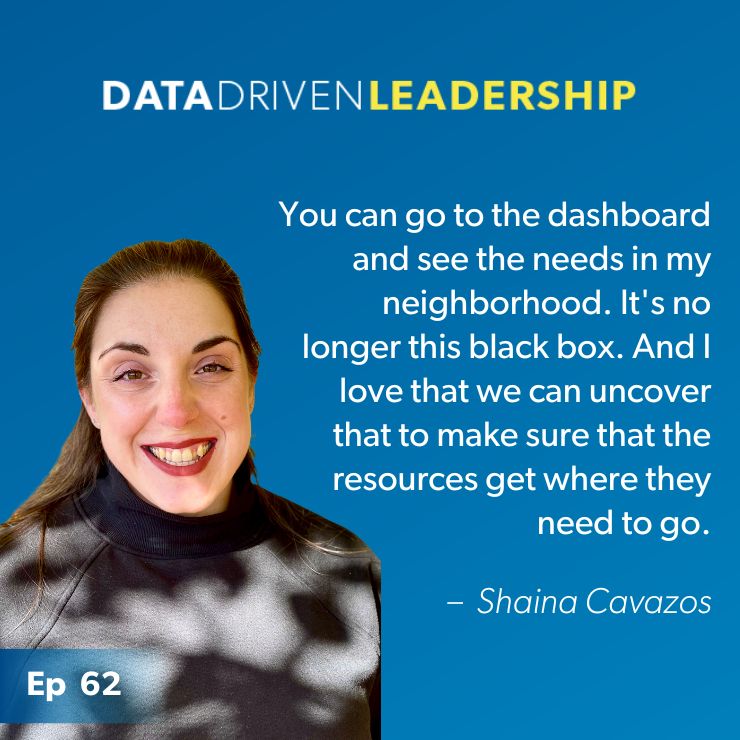
And so it's no longer this like black box of, oh, I have resources to provide, whether it's because I work in the community providing some kind of service, or I am a philanthropic partner. What do I do with it? Well, you can go here and see these are the needs in my neighborhood, you know, some of my neighborhood schools, it's just not a mystery anymore. And I love that we can uncover that to help really make sure that the connections that are happening are intentional and just really get where they need to go. I think it's more targeted as part of the benefit here.
Jess Carter [00:11:52]:
Absolutely. Well, and like, I think we're heading this direction. But like, one of my questions was going to be how can that data empower donors and funders to make more informed decisions about supporting schools in economically disadvantaged areas?
Shaina Cavazos [00:12:07]:
I mean, I think it exists, they can look at it. I think that if you're, you know, someone doing development work in Indianapolis and education is a priority, you should get on this dashboard today, if you can, and take a look at what's happening in your area. To, I think you can both use it in a way that helps you maybe provide some additional rationale or support to decisions that you're already maybe making or projects that are already happening or could be part of the agenda setting that you and your colleagues are doing for the future. We just see such an opportunity in making a version of this data available that just hasn't been done before and just having it be as specific as we can get to drive whatever that is.
So I have a good example that didn't. This isn't causal, but I think it illustrates how this can be pretty powerful. So we know that based on the interest data, we can see that there are kids in the city and one of their top interests is cooking. Which, as like a really avid cook myself, I think that's super cool that kids are getting interested in that.
Shaina Cavazos [00:13:10]:
So if I'm a, you know, a philanthropic partner, you know, how do I make that happen? If I'm a policymaker, whether the city or somewhere in the state or in a community, how can I help drive cooking? Well, what that tells me is that I know as someone who works for the city of Indianapolis, that one of our, our newest family centers, Frederick Douglas Family Center, has a kitchen, a community kitchen in it. And it's a really beautiful, the whole facility. I mean, it's been a wonderful opportunity for that neighborhood. But I know that kids are now interested in cooking. So I really want to make sure that they know that this place exists and that kids and their families who live nearby or really anywhere in the city can take advantage of it. That's a real thing that I kind of, as we were creating the dashboard, working through this data, a light bulb went off for me and I'm like, wait, I can connect them better to this city service, this city resource that is going to feed directly into the interest that they have.
Jess Carter [00:14:03]:
Oh, for sure.
Shaina Cavazos [00:14:04]:
Yeah. So I love that one and I'm super excited to let everybody know.
Jess Carter [00:14:08]:
Well, okay. It just helps me to hear you connect the dots because sometimes I think there's dashboards that exist and they get published and people are like, of course. Ta da. Like, of course, of course you should use this data. It's so meaningful. But it's like sometimes it does help to have someone be like, so this is how we might use it. I tripped over the section of it on barriers to services and service gaps. How unbelievably helpful that somebody might need something.
Jess Carter [00:14:32]:
But if you know that they have transportation issues or their family doesn't speak English or whatever, like their insurance isn't accepted, I mean, that would be an amazing place for somebody who's looking to make a difference in disadvantaged economic areas to go see what are the actual barriers and how do we fund the right things to reduce the barriers. Right?
Shaina Cavazos [00:14:52]:
Yeah. And, you know, I think sometimes there's certainly going to be folks kind of who might come upon the dashboard and see that, and it's, you know, it might not be news to them. You know, we know that transportation can be a hurdle. We know that families need access to language services. So, you know, maybe best case you learn something you didn't know and that's really powerful, or, you know, if you're already well informed in those ways, here's great justification that you can use to back up really any resource that you would then go to. You can say, hey, and I have the data to prove it. We can't always say that in as direct a way, I think.
Shaina Cavazos [00:15:23]:
And we just colloquially know that schools have needs, students have needs, but this just really, I think, allows us to drill down in a more specific way than we have been before and doesn't really put the onus on the school to do it. They're already doing plenty of data reporting, and I know that they're working closely to make sure that their coordinator has what they need to get this information. But that's part of the beauty of, is we have one staff member at the school who can really kind of wrap their arms around this entire process. And then they have support, too, through their technical assistance center at Marian. And it can, I think, just make sure that resources and responsibilities are very focused, but also not just falling on myriad school staff who have a thousand other things to do.
Jess Carter [00:16:06]:
I feel like you've hit that two different times, and it's worth saying a third, which is like, we often are using anecdotal information at best in scenarios like this. And we just, to your point, we just sort of know that these are challenges, the value proposition of saying the data exists, it's public, it's open, go leverage it in the right ways, Leverage it in your grant requests, leverage it when you're talking to your executives about where they need to invest. This is like, what a gift. Like you've packaged it up in the prettiest package with a nice bow on top. I, I think it's awesome. I mean, this is like, it's super neat. Yeah, absolutely.
Shaina Cavazos [00:16:41]:
We're excited. And I mean, the folks at Resultant helped us make it extra pretty extra readable. And I really have to just really have to call out Boston College and Tina Chenxu and her team there because they really were so thoughtful in trying to decide how do we use this data to make sure it's really true to what we're doing? How do we really protect students and families in schools? Because, you know, we know that there's so much fun and, you know, really interesting things we can see here, but there's a lot of needs that families have that aren't always things they want to share. So how do we make sure they're still getting connected with those resources and not put anyone in a position where they are made more vulnerable by the sharing? So we've, we've tried to be mindful of all of that, and I think we've landed in a place where we can make those connections, show that specificity, but also protect people in their time, perhaps of greater need.
Jess Carter [00:17:33]:
That is so neat. I am geeking out a little bit. So again, permission to be like, Jess, I don't know. Are these, is this data… I'm curious how you are collecting it. Is it like the person at the school that's entering all this data as they work with the kids?
Shaina Cavazos [00:17:46]:
Yeah. So my base level understanding, which I think is probably good because that's what most folks are gonna, gonna have, is that the, the coordinators, they have a whole system where they're entering in information about students. Every student gets this individualized support plan. And it's the coordinator's job to make sure that every kind of student on their caseload has that plan. And as they're collecting that information, they're doing, you know, regular updates. Everything involved in that process, there is data that gets pulled out of that that essentially we are using to feed into the dashboard. So we're kind of turning the qualitative in some ways into quantitative and choosing what we can share and then of course, not sharing anything that we shouldn't.
Shaina Cavazos [00:18:31]:
So, it's the coordinators are the ones who are collecting the information. And then it kind of runs through the team at Boston College and Marian. They work very closely with the coordinators during kind of those processes and reviewing the information and the systems. And then the dashboard, you know, it's based on spreadsheets, but it's really being driven by the work that those coordinators are doing through the individualized student support plan.
Jess Carter [00:18:53]:
That is so cool. Looking ahead. So we're in year three of three. Do you anticipate the program continues?
Shaina Cavazos [00:19:02]:
So part of the goal with, you know, we knew that the ARPA funding would be, would be limited. Marian is working with schools to figure out those next steps right now. And there are going to be schools who are, you know, not able to continue. But the hope has been that with three years to work with a coordinator, have this person as an employee in your school, that they would be able to take on those costs and build that into their budget over the lifetime of the grant. And I think there are schools that are going to be able to do that. And then Marian is also going to provide support, and they're already providing support to see where schools might be able to take advantage of other grant funding or just other opportunities to continue this work. But I think we hoped that three years would be a bit of a.
Shaina Cavazos [00:19:46]:
Kind of a phase in, and that schools would see the value and be able to keep moving it forward.
Jess Carter [00:19:52]:
I just think it's neat because I'm also thinking about, gosh, how cool would it be longitudinally to see year over year, not just three years, but five, ten? Like, how aggressively are any of these needs and interests changing? Um, I don't know. Have you already seen some of that play out, or are we sort of still collecting that?
Shaina Cavazos [00:20:08]:
We're still really looking at that because the second year of data we just got this fall, because it kind of has to be worked through and distilled down a little bit. But already, I mean, I, you know, I'm a former reporter. I love geeking out over data, too, and I love seeing change over time. And I think, again, it's a great way to kind of affirm things that we think we know and then inevitably reveal things to us that we haven't even thought of yet. So I'm excited to see how student interests change. I'm excited to see, as, you know, schools get, you know, other access to things in the city. How do some of those barriers change? What are coordinators seeing in schools that they're reporting back? And how can we use this as a way to understand how problems are being addressed or maybe how some are being exacerbated?
Shaina Cavazos [00:20:50]:
So I, I think we're still learning a lot of that, but by this time next year, we'll have a third year of data and another great opportunity to see how things are moving in our community.
Jess Carter [00:20:59]:
So then when I think about other, maybe other school districts or schools or cities that want to do something like this. Do you have any advice you'd give them? Like what do you wish someone had told you? Or maybe you, maybe you got advice.
Shaina Cavazos [00:21:12]:
You know, we were able to provide the support and the funding. I've learned so much just by being part of this. I would just say any district, any community, any city should really get in touch with Boston College and the Mary Walsh Center for Thriving Children because they are doing really incredible work. And if you aren't in or near Boston or this isn't part of your regular day-to-day, you might not know. So I would encourage you, if you do go to connectindy.org, you will be able to kind of reach out and see all the different partners that are involved. I would visit their website, learn more about City Connects as a practice. And they also have a lot of publications and resources that show that return, the strong return on investment. And I think that was what was really compelling to us.
Shaina Cavazos [00:21:54]:
And I think one of the first things that I heard where I was like, why? Yeah, let's absolutely move this forward. It made me excited was that there is a documented return on investment. We do have data to back up, up the work that's being done. And if there's evidence, then, you know, that's usually the first hurdle. And so I think Boston College has done a great job addressing that already. And that should be, you know, I would imagine, just a comfort or a push to anyone else who wants to take the leap that you've got a lot of good information behind you already.
Jess Carter [00:22:24]:
Absolutely. I'm totally geeking out now because one of my other questions was going to be Boston College's involvement. Like one of the things, I really do love that you can look at each school year, calendar year, but is there any feedback you guys get yet? Or maybe this is something that could happen in the future where Boston College could also show, like, how does the program in Indianapolis…are the barriers similar or dissimilar than in other areas using the same program?
Shaina Cavazos [00:22:50]:
I have that question too. I always love to know, how are we? How are we different? Are things unique? I do know that like internally, of course, they're able to kind of see how the data stacks up. I would love to be able to kind of help be that launching pad for them as they maybe consider what it would look like. But I know that it was really important to them to work on this dashboard and kind of do this first ever opportunity to make the data public. So it really was, I think, a leap of faith for all of us involved, particularly on the data dashboard side, just because it hadn't been done. And so if I'm learning as much as I am, I can only imagine that everyone has really strong takeaways. And I think the folks in Boston, I can't imagine they're not also sitting somewhere kind of geeking out over the data and being able to share with us. Because I would love for us to have greater context, too, about how we are like, or unlike other cities.
Shaina Cavazos [00:23:35]:
And, you know, that's a good question. I. I think I'm going to ask them that at our next. At our next meeting, how we can learn more in that direction, too. Because I'm now, I'm now I'm interested.
Jess Carter [00:23:42]:
Right. It's just so neat because you do like, the barriers, the differences between the first two years are actually pretty substantial. Like, they changed a lot. And so then I'm asking questions about, in my head, I'm like, well, did they add more schools? And maybe that's what changed? Or the resource person actually helped connect the dots on some things and that's why, like, you know, like, insurance not accepted went down substantially between the two years. And so it's like, well, did we find providers for things that were generally covered by lots more insurance? So I just. It's really interesting, like, what you've done is so cool. What your team has done is so cool.
Jess Carter [00:24:12]:
And to your point, you're handing data to anyone who wants to use it to better this component of our society. I think that that is just one of the most important things anyone could be doing. Like, I assume I can kind of hear, like, both the data geek in your voice, but also just the passion. Like, I imagine this is definitely a passion project. Is that fair?
Shaina Cavazos [00:24:32]:
Oh, absolutely. I mean, I think for everyone involved, for me, you know, for Patrick, the reason, you know, we've been working so hard and so long. Yeah. It is because it is really important. And the internal meetings that we have, you can just tell everyone really wants to get it right. And we're so excited about this as a starting point. And I think kind of your, your point about how things change year-to-year is a really good one, too, because of course, you know, this is the first time that this information is being displayed in this way. It is very much still a starting point, but I think it's an opportunity to then connect with, you know, connect.
Shaina Cavazos [00:25:01]:
How many times can we say that? Right? To then connect with those schools or to connect with those providers to learn more. So this is not the end. The dashboard is not like the end of any one of these stories. It is really only the beginning. And so, as people are looking and asking questions and reaching out to us and to Marian and to Boston College to learn more, I think that's how we get to the place where students are served better and have more opportunities and their families are able to, you know, move forward in the ways that they need, because we keep asking questions about it. So, yeah, I mean, you raise great points, and that's where, you know, the more years of data we have, I think the better able we'll be to show those trends and to answer those questions. But also, I hope other people are curious and that they ask those questions and that we can try to find out, because I think that'll. I think it can only really lead to better things for.
Shaina Cavazos [00:25:52]:
For students.
Jess Carter [00:25:53]:
Agree. I mean, like, if I had a wishing well. The only thing I wish is that you had this data set up, like, pre-2020. Like, it'd be so interesting to see all that. But there's other data that points to why we're here. Right? And so I've got a couple of kiddos, and I'm looking at this thinking, like, I'm just so grateful that the city of Indianapolis is thinking through how to bring innovative programs like this to our populations. Like, how.
Jess Carter [00:26:16]:
How cool. What a cool job you have.
Shaina Cavazos [00:26:18]:
I do. I do. I'm pretty lucky in that way. Every day is interesting, and this is one of those projects where it's really stretched me, but also helped me kind of dive back into things that I love, like data, like design and graphics. Gotten to work with such talented people, and it's just fun thinking through, hey, how do the colors of this dashboard, what do those things communicate? How do we address the fact that people might encounter this and they don't speak English as their primary language in all these different questions, it makes it just such a great project. And this connects kids with better services so that they can learn. I mean, that's really the foundation of everything that I'm doing—or trying to do, anyway. And that, that's.
Shaina Cavazos [00:26:59]:
This got to be another project that adds to. It is, is, has been a great opportunity.
Jess Carter [00:27:04]:
Yeah, that's so cool. I mean, because there's a lot of times people will spend. It's like they're either in the classroom because they care about kids learning, or they get to do sort of, I would call it, like, more holistic insights policy. Right. But this feels a little bit like you get to kind of be really involved in, like, the micro and the macro. There's a little bit of play at both in this program, and I think that that's super neat. Okay, before we wrap up, is there anything we haven't talked about that we should.
Shaina Cavazos [00:27:27]:
I actually think we've covered quite a bit. No, I don't think there's anything I'd add.
Jess Carter [00:27:33]:
Okay, then let me ask you this. If people want to learn more, we will put the dashboard in our show notes. But if they want to follow you, are you on LinkedIn? Is there somewhere they can follow you to keep up with what you're doing?
Shaina Cavazos [00:27:44]:
They can. I'm LinkedIn under my name, Shaina Cavazos. You can also learn more about our work at OEI, Office of Education Innovation, oei.indy.gov. And in the Dashboard, like I said, you can have access to all of our other partners and learn more about City Connects and all the great work that they're doing, too.
Jess Carter [00:28:05]:
That is awesome. Okay, Shaina, thank you so much for being with us today.
Shaina Cavazos [00:28:09]:
Yeah, thanks, Jess.
Jess Carter [00:28:10]:
Thank you guys for listening. I'm your host, Jess Carter. And don't forget to follow the Data-Driven Leadership wherever you get your podcasts and rate and review, letting us know how these data topics are transforming your business. We can't wait for you to join us on the next episode.
Insights delivered to your inbox


