We recently wrote a blog about several different rollout strategies of Tableau into your organization, where we outlined when each strategy can work, and when each strategy can potentially fail.
Each of these strategies have one thing in common: at some point, they empower the business users to work with data in a different way than they have before.
A traditional BI rollout often fails because it is not focused on empowering the business – read on to learn more.
A Background on Traditional BI
This method formed from BI 1.0 in the 1990’s and early 2000’s. Data is clamped down, security is strict, and someone in IT is policing the records. There’s a limited number of analysts working with the data and creating the dashboards. This limits how data is used in the organization, and breeds animosity between the business and IT. Based upon our experience, we do not recommend a traditional BI Tableau implementation.
A traditional BI implementation has characteristics of the Data as a Software rollout strategy, but instead of creating a branded product, the IT department attempts to provide all the analytics for every department. Data is clamped down, security is strict, and someone in IT is policing the records. There’s a limited number of analysts working with the data and creating the dashboard.
So why is this traditional approach incorrect when paired with Tableau?
Let’s have a brief history lesson on the BI industry.
In the 1990’s and early 2000’s, BI technology was focused on building the infrastructure of data rather than the insights from data. The reporting solutions offered were complicated, hard to use, and not efficient. Since they were so complicated, a select few IT individuals were responsible for all the reporting needs. If you wanted to see the data in a new way, the answer was ‘Not at this time – please create a ticket.’
(For a more in depth understanding of how the BI industry formed, check out Stephen Few’s blog here: Blog Article
But we are no longer in the 1990’s. In the mid-2000’s, there was a self-service BI revolution – let’s call this BI 2.0. Tableau lead this revolution with it’s easy to use drag and drop means of seeing and exploring data. It changed the paradigm and allowed business users to create their own dashboards. It was built off of an idea of trusting analysts to explore data and drive decision making, instead of by default not trusting analysts to connect to the data.
For a deeper dive into this idea of trust, check out this blog: Blog Article
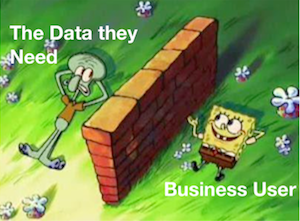
Tableau thrives as an easy to use BI tool that connects the users who need to see the data with the data itself. A traditional BI deployment puts a brick wall between those who need the data, and those who have the data. A rollout that enables business users to connect to and explore the data they care about tears this brick wall down and enables IT to spend their time elsewhere.
Traditional BI Paradigm
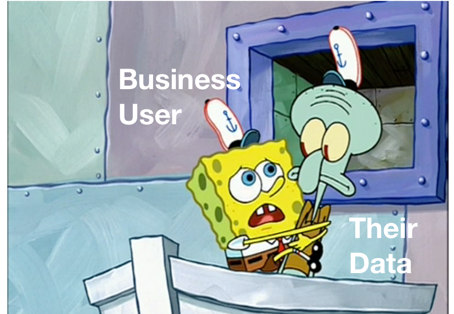
A Better Paradigm
Still skeptical?
Are you planning to roll Tableau out like you’ve rolled out every BI tool before? Here are our personal testimonials on why that isn’t a good idea:
Bridget Cogley, Tableau Zen Master:
I started my career on the business side of the house. I’ve run a few different departments, including HR, training, process improvement, and sales. I worked at a place fueled by Excel. We’ve all done this at one point or another – ran our business of spreadsheets. It starts from need and grows to the point of frenzy. I was part of the committee that looked for a better BI solution.
Legacy BI demands we wire-frame our reports, gather all the data, pre-calculate (if we’re pairing it with a cube), and design with the destination in mind. We demoed quite a few tools that were at least enjoyable for the end user, but certainly not fun for us (the analysts) to use. Tableau took a different approach – we grabbed some data and made things. No drawing. No preplanning required. What we were able to do in the following months and years was completely reform our business and escape the reporting trap. We could track when to hire, what clients were performing best, and easily customize solutions for our clients because slicing through the data stopped being a pain. Escaping the classical BI loop – the one that says IT and business cannot play together and that analysts can’t be trusted – allowed us to get immediately to our decisions.
With Tableau, I used open data and sliced through data in minutes, allowing me to quickly find patterns essential to my business. It allowed me to have open conversations with clients about their realities – they were always shocked by the accuracy of my findings. Moreover, I could lay my domain expertise on top of this, navigate areas of risk, and improve their offerings while reducing risk.
Preston Howell, Client Success Leader:
Once upon a time, I had a week-long consulting project at an organization using a traditional BI tool. The end goal of the week was to design a set of dashboards. To accomplish this, we had an expert in the BI tool, a data visualization expert, and some of their business analysts. The analysts didn’t have access to their BI tool, and their BI tool expert couldn’t keep up with all of our ideas, so we had to create designs in Excel. On day 4, I became frustrated at the slow pace. I extracted data into excel, and created prototype dashboards using Tableau. These were then screenshotted, handed to the BI guy, and re-created in their BI technology a month later.
Now imagine this story if they had rolled Tableau out and given analysts access to data: you have a group of people in a room (business analysts and a viz expert). Each analyst can connect to and build from data they are interested and familiar with, and I can assist them with the design aspects of their dashboards. At the end of the week, we would have working prototypes of all dashboards.
Do you see the difference? In the traditional BI rollout, the analysts aren’t given access to the data or the tool to create reports – this leads to major wasted time. In the Data as a Service Tableau rollout, the analysts are empowered by having access to their data and can create dashboards themselves.