
Workforce Solutions For North Central Texas Leverages Interactive Dashboards, Visualization, And Labor Market Data To Enhance Workforce Development Initiatives
Share
Story Highlights
The Challenges
Complex Data Analysis
While valuable labor market insights existed, they were often difficult to analyze and required technical expertise to interpret. This created barriers for stakeholders who needed data-driven insights to support workforce planning, economic development, and career decision-making.
Lack of Interactive, Dynamic Visualization
WSNCT sought a solution that would go beyond static reports and spreadsheets. They needed interactive, user-friendly dashboards that could dynamically visualize labor market trends, track workforce demand, and highlight career pathways—all while ensuring data accuracy and relevance.
The Solutions
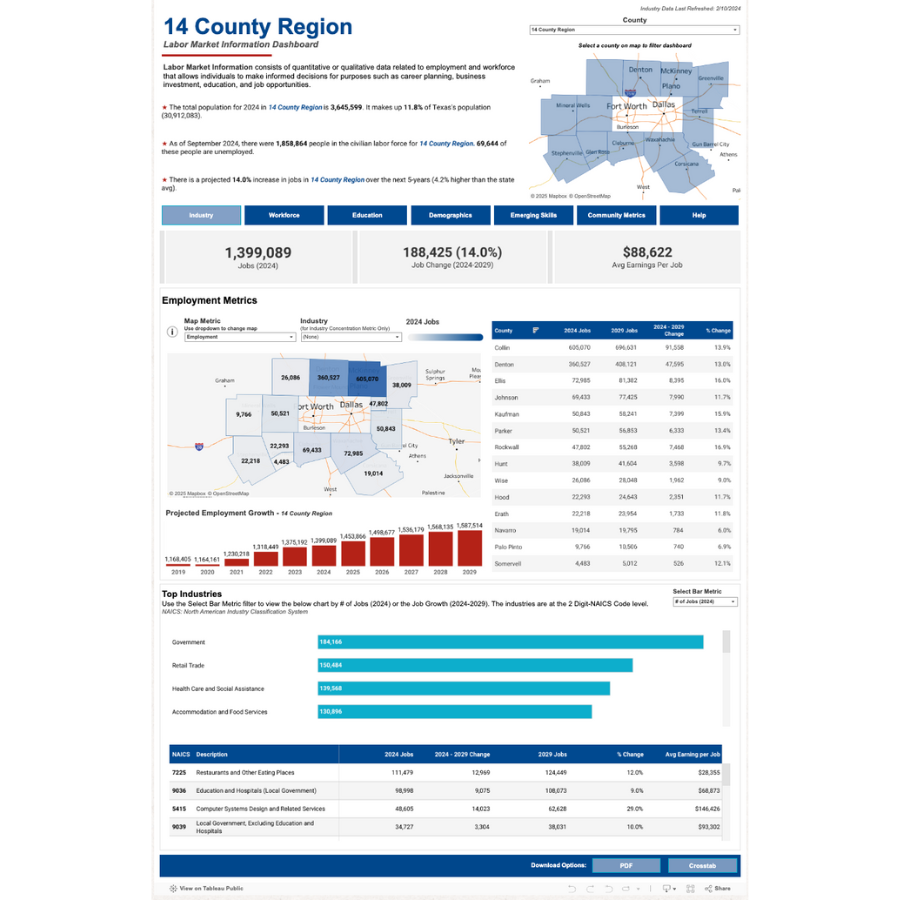
LMI Dashboards
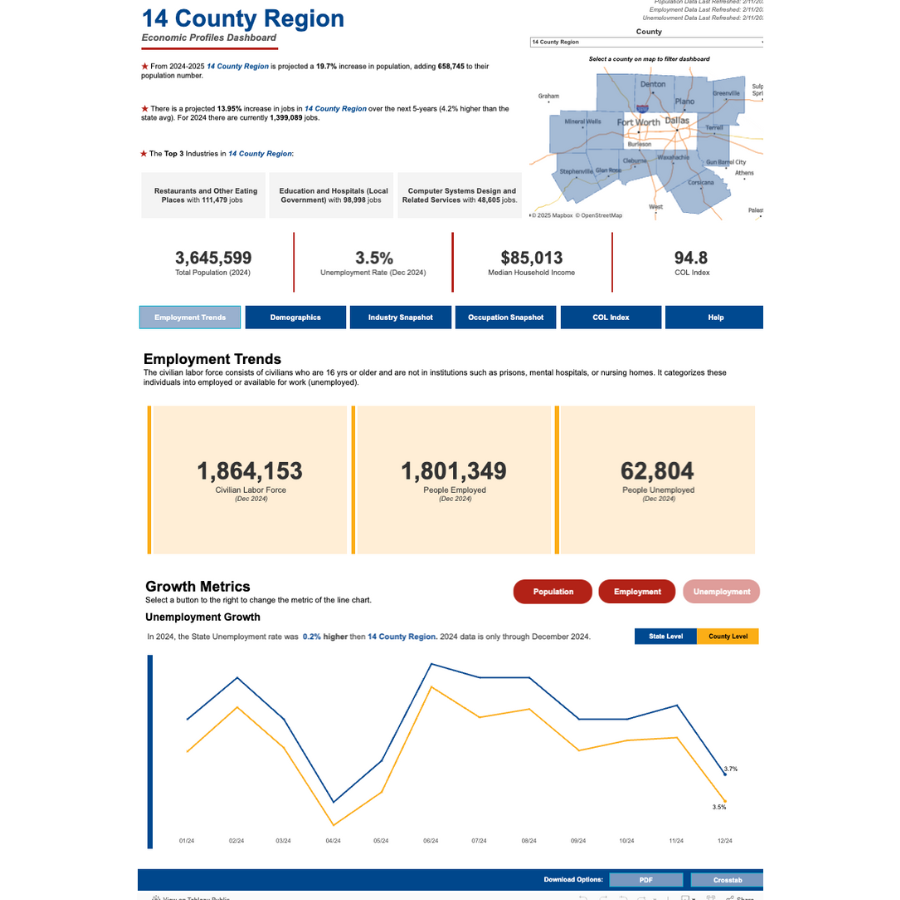
Economic Overview Profiles
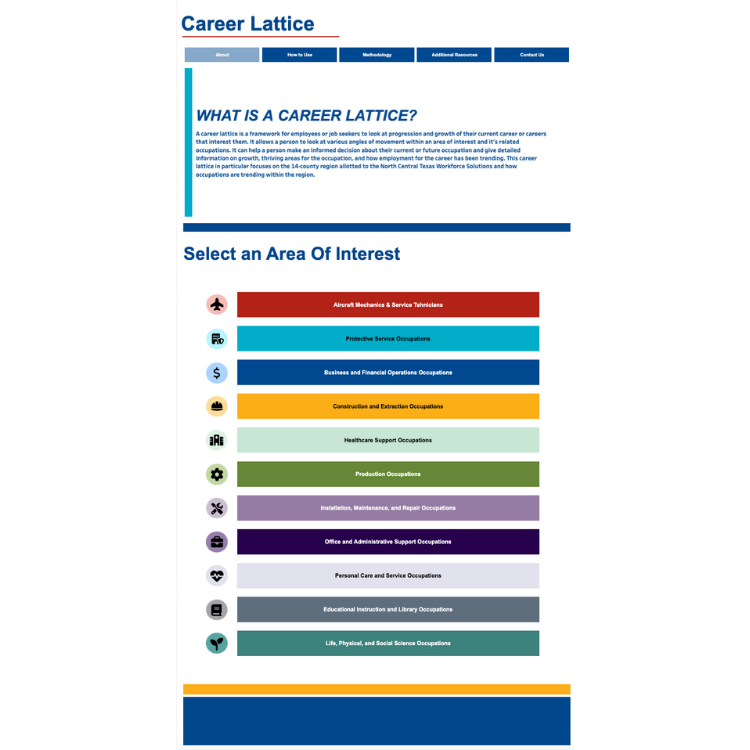
Career Progression Lattices
Implementation
The Results
The design and implementation of LMI dashboards, economic overview profiles, and career progression lattices provide WSNCT with a reliable, user-friendly solution to support the organization’s programs and stakeholders.
With a new web-based LMI dashboard system, WSNCT is a leading labor market information provider in Texas, making information accessible and understandable to users and providing valuable insights to employers, jobseekers, workforce and economic development professionals, and communities.